The big news for renters since Labour entered government is the announcement of the Renters Rights Bill, which will finally abolish Section 21 evictions. But, aside from plans to ban bidding wars and extend Awaab’s Law to the private sector, and the absence of opponents of the Bill on the government benches, this is currently very similar to what the Tory government was proposing.
The main difference between the new government’s housing policy and the last one’s is around building, with Rachel Reeves reintroducing local targets within days of becoming Chancellor, and Angela Rayner’s announcement on Tuesday of detailed proposals on planning.
While the government is aiming to build 1.5 million homes in the next five years, it has not been especially clear what benefit this will have on ordinary renters – especially when most of the new homes won’t be social housing (50% will be, but only on “grey belt” land), and the level of house prices has as much to do with interest rates as how many there are.
Well, for the first time we have enough data on rents to get our heads around the relationship between building and how much you spend on rent. In short, the more we build, the more affordable rents get – but to help those struggling the most, we need to do a lot more.
We looked at changes in housing stock, population, rent and salary data for 90 metropolitan areas around England since 2015. Overall, an increase of 20 homes per 1000 people reduced rent as a proportion of average salary by 2.8 percentage points.
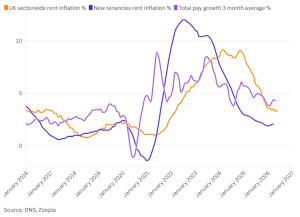
Back in December, Generation Rent research found that, nationally, rents could be predicted using just wage growth, housing stock and population projections. Rising wages and population put upward pressure on rents, and increasing housing stock (of any tenure) puts downward pressure on rents. This new local rent data from the Office for National Statistics (ONS) lets us, for the first time, see what happens when your local council fails to keep up with a growing population.
The data also shows that there is no relationship between rent affordability and the size of the private rented sector (PRS) as a proportion of all homes, casting doubt on the claims of some (the National Residential Landlords Association and Reform UK) that encouraging landlords to buy more properties would help.
This is because changes in tenure don’t make a difference to the fundamental factors that determine rents. A landlord buying an existing home reduces the number of homes available to owner occupiers, so another would-be first-time buyer household continues to rent. While the number of rented homes increases, so does the number of households who have no option but to rent.
What this all means
The evidence of the last eight years shows a clear relationship between housebuilding and affordability. Areas where building failed to keep pace with the local population saw rents rising faster than incomes.
More troubling is our estimate that if the number of homes only just kept up with the population, rents would still rise as a proportion of salaries by an average of 1 percentage point over the 8-year period we looked at. Along with the fact that these are averages, it is essential that housebuilding policy benefits people on lower incomes, who are struggling the most with private sector rents.
Importantly, the evidence shows that it’s the building that matters, not tenure. Simply encouraging landlords to buy up existing homes will do nothing to make homes more affordable.
But policymakers must also recognise that it still takes a lot of building to make a difference to affordability. Those of us who are worst hit by the housing crisis are not earning enough to pay in rent what average earners can afford, so the government must do much more to build social homes, and make sure Local Housing Allowance keeps up with market rents.
How we did the research:
The new local rent data has made it possible to look at the effect of changes in housing stock, as a proportion of the population, on the affordability of rent at a local level. Affordability can be measured as rent as a proportion of income/salary – spending 30% or more is considered unaffordable.
Generation Rent looked at rent affordability rather than rents only, because if rents rise faster than incomes, this is worse for the local population than if incomes had risen faster than rents. Similarly, the research looked at homes per 1000 people because if the population is growing faster than the housing stock is, one would expect upward pressure on rents.
Between 2015 and 2023, 70 of 91 urban areas in England saw houses get built at a faster rate than the local population grew. Of these areas, 42 saw rent as a proportion of the average local salary fall, i.e. affordability improved, with no change in a further two, while 26 areas saw rent as a proportion of the average salary increase, i.e. affordability deteriorated.
Among the 16 areas which saw the housing stock fall as a proportion of the population in the same period, just one area saw rent affordability improve, with the remaining 15 experiencing a deterioration in affordability. (Five areas saw housing stock rise in proportion with population – two saw rents get more affordable and three got less affordable.)
In contrast, there is no evidence that the private rented sector taking up a larger share of the housing stock would make rents more affordable. Between the years of 2015 and 2021, 85 of 93 urban areas saw the PRS shrink as a proportion of the total housing stock. Of these, 45 areas saw rent affordability improve, while it worsened in 37 areas.
In the seven areas where the PRS grew in that period, rent affordability improved in four and deteriorated in three. (One area saw no change, and affordability improved.) There is therefore little relationship between the size of the PRS as a proportion of all homes and rent affordability.
Generation Rent used data from the following sources:
- Average rent recorded by the ONS Price Index of Private Rents at October 2015, October 2021 and October 2023
- Mean gross annual pay for all employees, recorded by the ONS Annual Survey of Hours and Earnings for 2015, 2021 and 2023, Table 8.7a
- Housing stock as recorded by DLUHC Live Table 100, for 2015 and 2023
- Population as recorded by the ONS annual mid-year population estimates for 2015 (dataset MYEB3), and the ONS provisional admin-based population estimates for mid-2023
- Private rented homes as a proportion of total dwellings for 2015 and 2021, recorded by the DLUHC Subnational estimates of dwelling stock by tenure
Generation Rent focused on urban areas only as smaller renter populations in rural parts of England mean that data is less reliable. Not all areas had sufficient data to permit inclusion in the analysis.
The estimate discounts Westminster, which is an outlier. Its population fell dramatically in this time but it saw affordability get worse, possibly due to the rise of Airbnb in the borough, reducing availability of homes.
It is also interesting to see such big improvements in affordability in other inner London boroughs like Hackney and Tower Hamlets. This is likely to be the result of wealthier people moving into these areas, rather than existing residents getting much bigger pay rises than people in other areas. This extra spending power by residents would have had an impact on rents, but it would have been much worse, and more existing residents would have been forced to move away, had it not been for high rates of housebuilding (though more social housing would have made outcomes better).
The data used in the analysis can be found here.